VK Video · Creator tools
Rebuilding the creator workspace for clarity and growth
I redesigned a legacy creator product into an adaptive, PWA-ready workspace and introduced clearer channel analytics.
01 · Context
A core product that had outgrown its interface
The Creator Workspace is where authors manage videos and track channel performance. The existing product carried years of interface decisions, worked poorly across screen sizes, and made important analytics harder to understand.
Product challenge
Modernize a complex tool without disrupting familiar creator workflows or hiding the actions people used most.
Design objective
Create a clear adaptive foundation that could support a PWA experience, new sections, and more useful channel insight.
02 · Approach
Fix the system, not just the surface
Reframe the information architecture
I reorganized the workspace around the tasks creators return to most: managing videos, understanding channel health, and taking the next publishing action.
Build for an adaptive product
A new responsive grid and reusable UI patterns made the interface work across desktop and PWA contexts while giving future features a consistent structure.
Make analytics actionable
Together with the product manager, I defined the channel metrics creators needed to interpret performance and connected them to clearer visual hierarchy.
03 · Mobile version
Channel analytics, always within reach
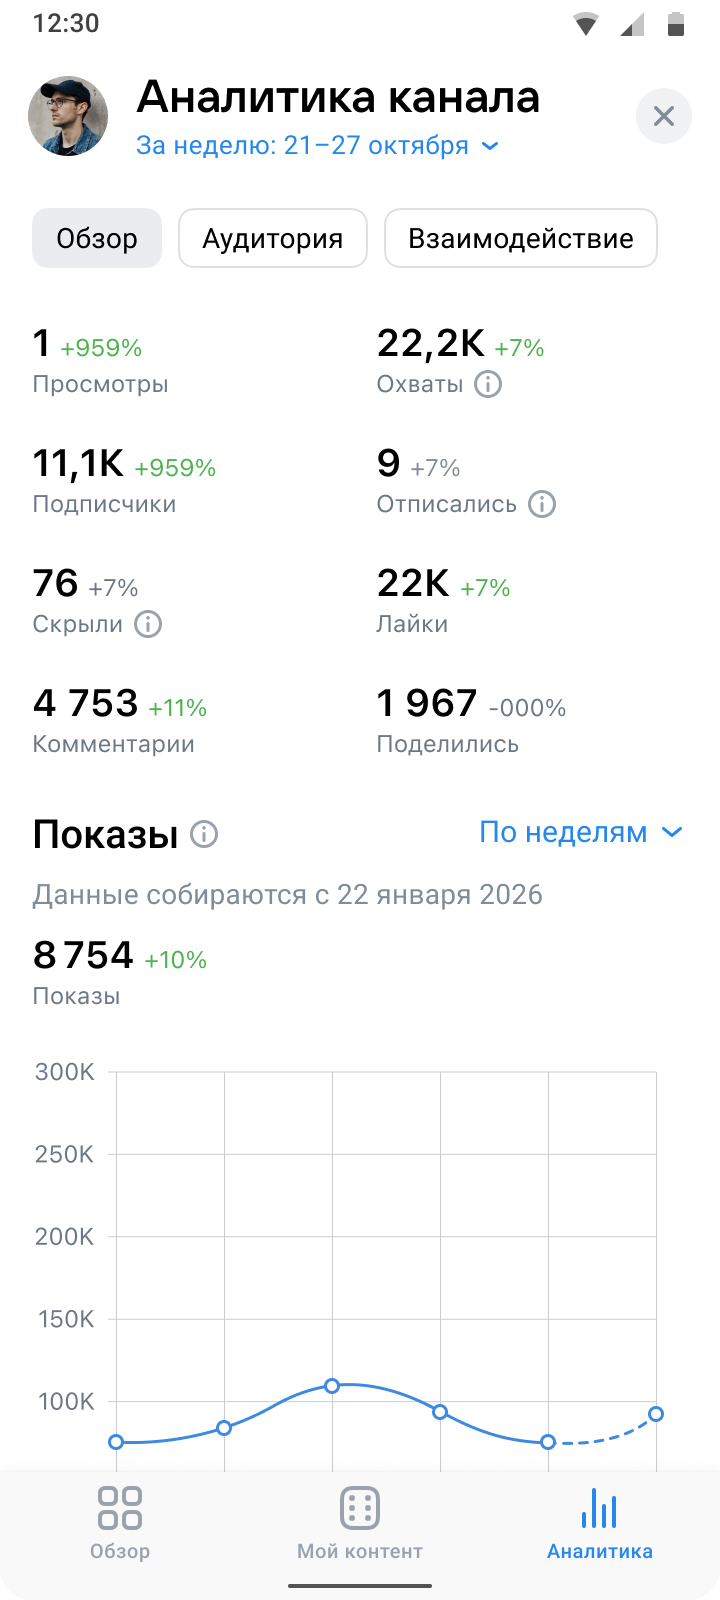
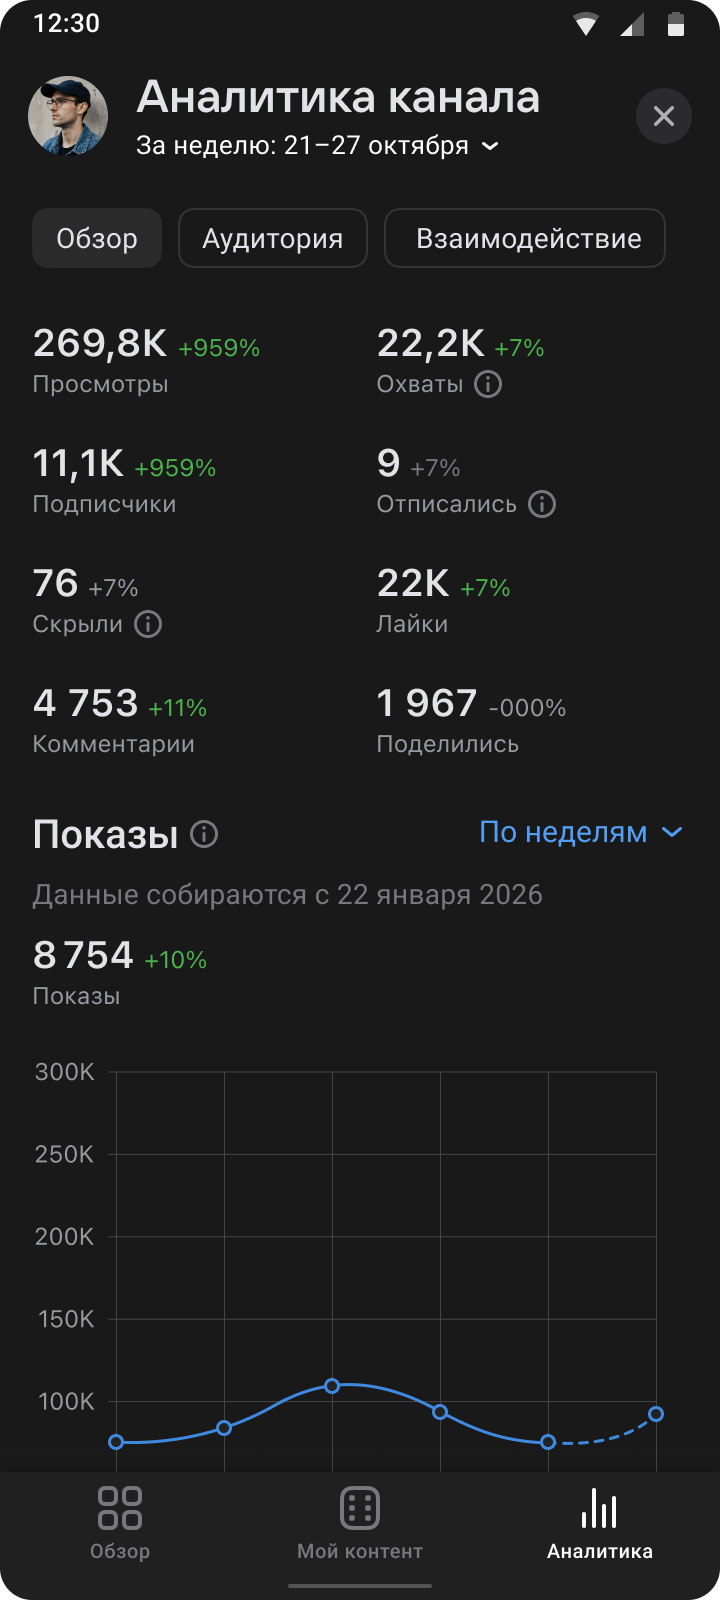
The PWA experience lets creators monitor key channel metrics away from desktop. The interface adapts to a narrow screen, keeps the most important data prominent, and supports both light and dark themes.
04 · New metrics
The metrics creators were missing
Creator requests repeatedly pointed to the same need: understanding which content performs well and why. We expanded analytics around that feedback, adding published-video performance metrics and a dedicated CTR trend so creators could identify opportunities to grow their channels faster.
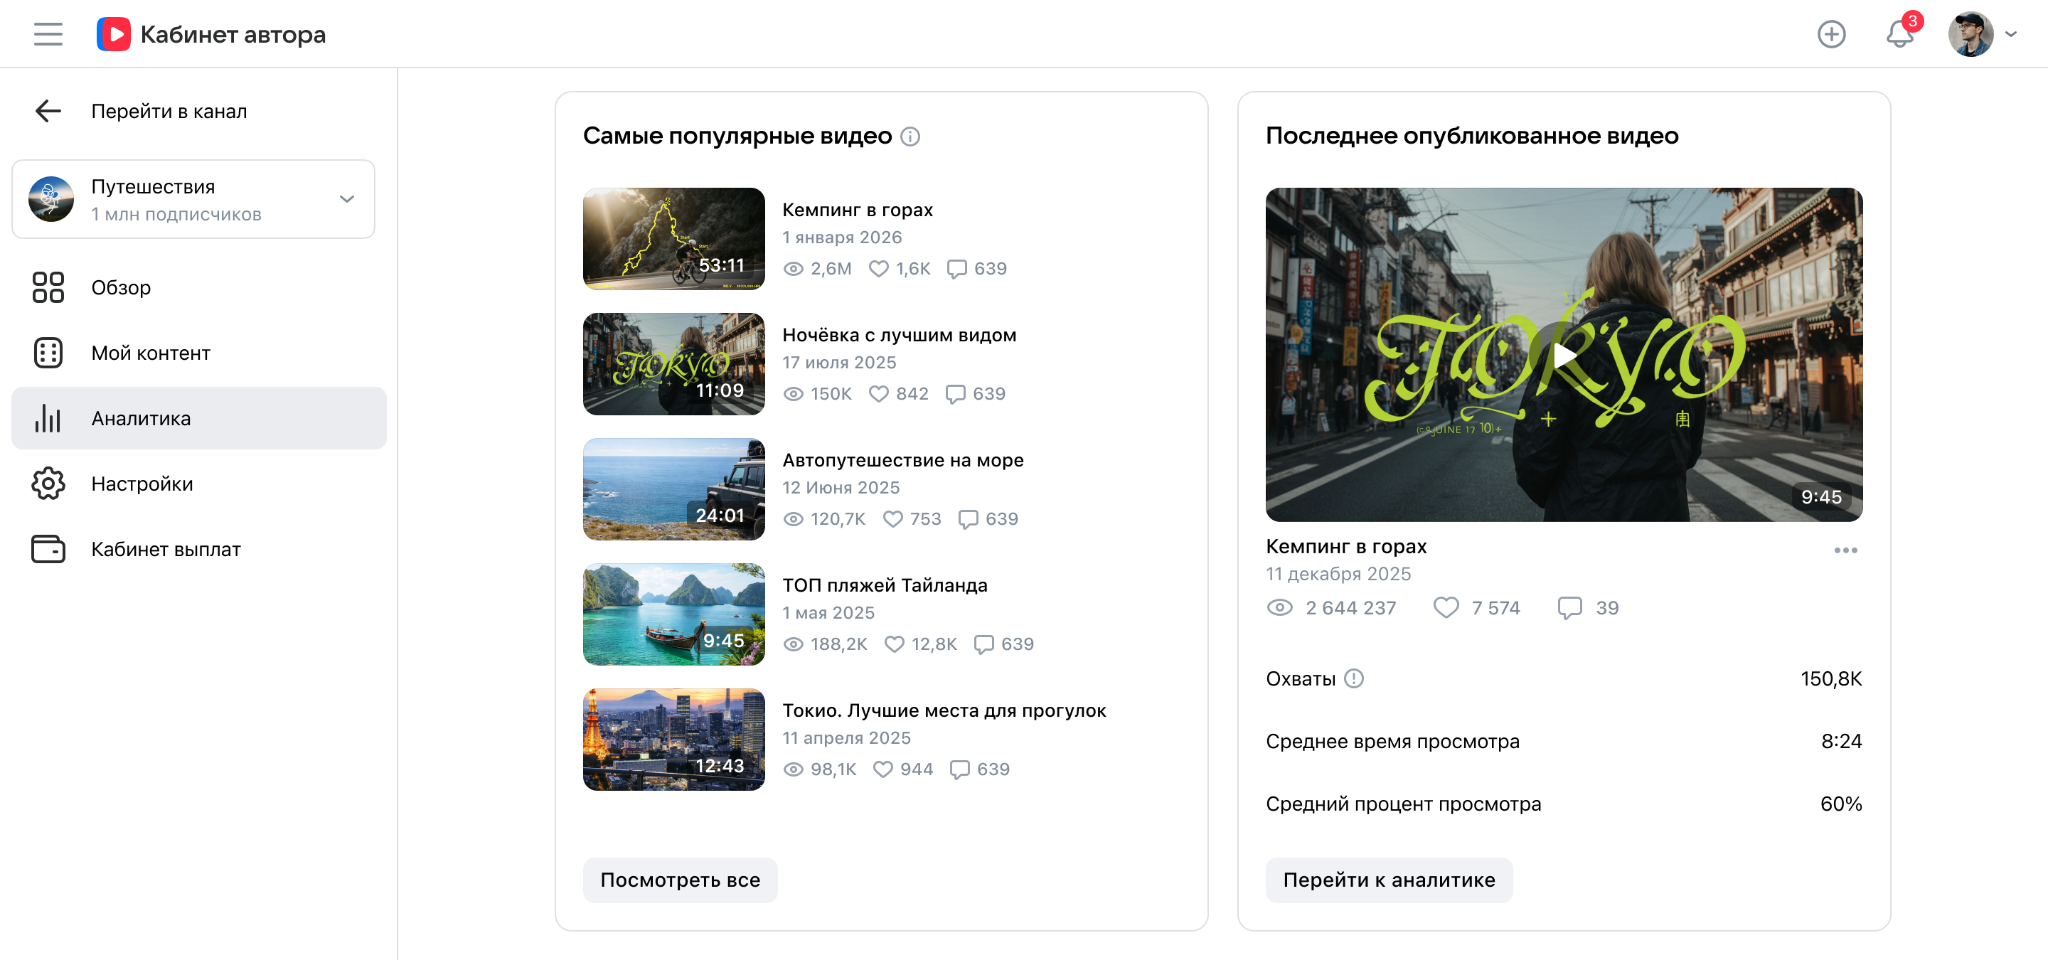
Creators can compare popular and recently published videos, reach, average watch time, and completion rate in one quick overview.
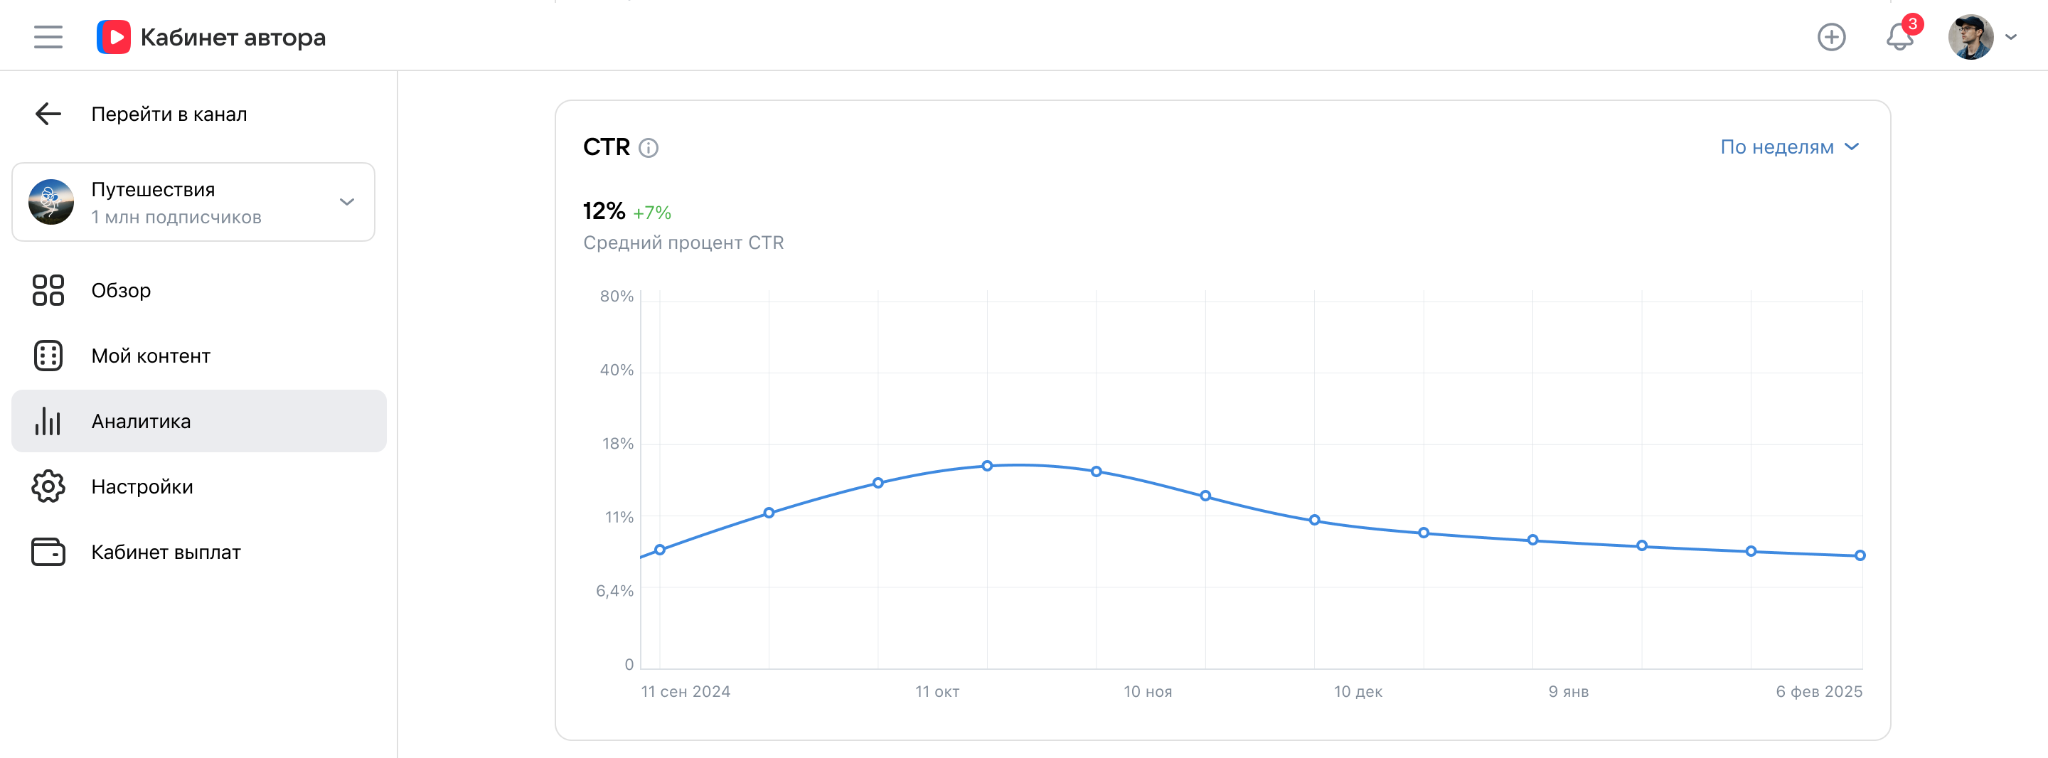
A dedicated chart shows how click-through rate changes over time and helps creators evaluate how thumbnails and titles affect audience interest.
05 · Outcome
The rollout increased meaningful product use
The project also established a UI kit, a pre-development quality checklist, and a design-review template that the team continued using in regular practice.